Dashboard
Your command center for monitoring repair shop operations. Get insights into ticket status, performance metrics, technician workloads, and recent activity to keep your business running smoothly.
The RAD Repairs Dashboard provides a real-time overview of your shop
Overview: What the Dashboard Shows
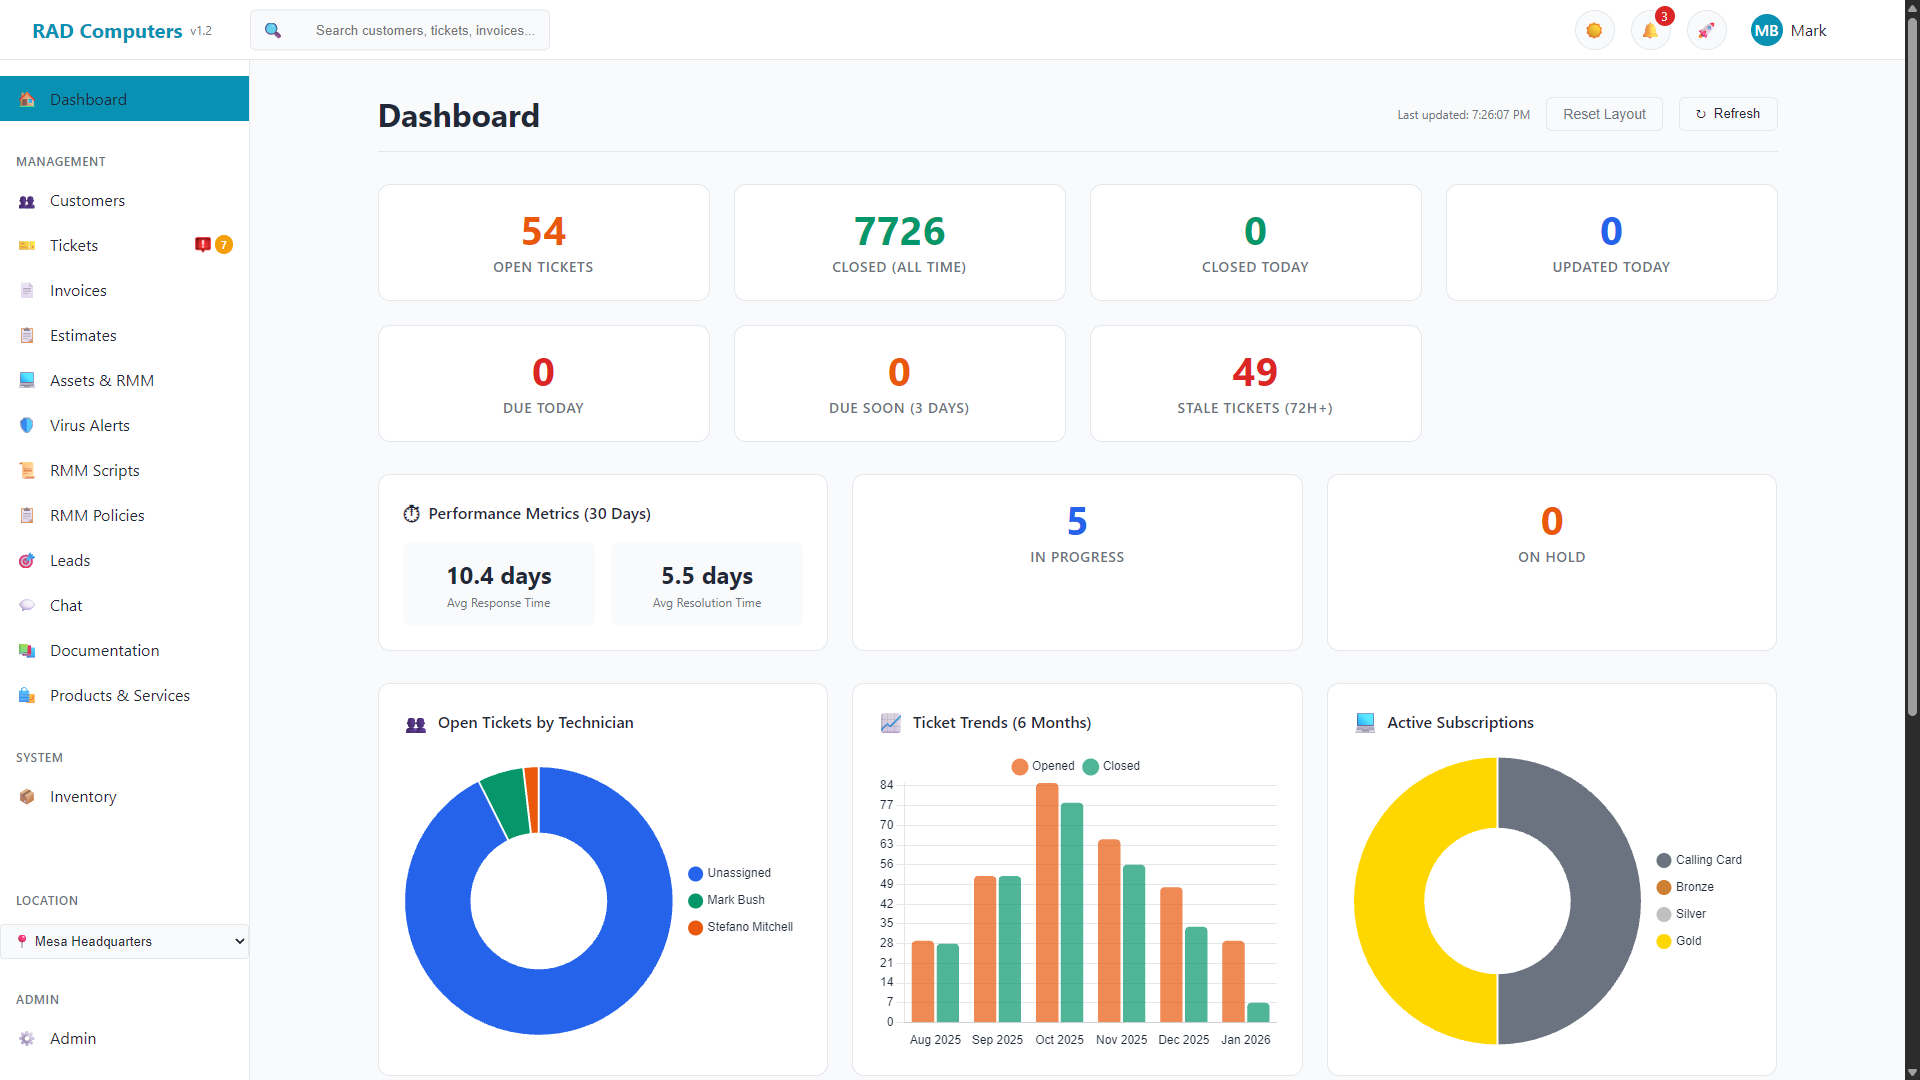
The RAD Repairs Dashboard is the first screen you see when logging into the application. It serves as your central command center, providing an at-a-glance view of your entire repair shop operation. Whether you manage a single location or multiple shops, the dashboard consolidates critical information so you can make informed decisions quickly.
The dashboard is designed with busy repair shop owners and technicians in mind. Instead of navigating through multiple pages to understand your shop's current state, you can immediately see:
- Ticket Status Summary - Counts for open, closed, in progress, on hold, stale, and due soon tickets
- Performance Metrics - Average response time and resolution time over the past 30 days
- Visual Charts - Open tickets by technician, monthly ticket trends, and active subscriptions
- Recent Activity Feed - A chronological list of the latest ticket updates
- Customizable Layout - Drag and drop widgets to arrange the dashboard your way
- Needs-Attention Badges - The sidebar shows alert badges next to Tickets, Customers, Invoices, Estimates, and other sections when items need a response - for example tickets in "Customer Reply" status
Pro Tip: Make the dashboard your browser's homepage or bookmark it for quick access. Click the Refresh button to update all dashboard data, or use the Reset Layout button to restore the default widget arrangement.
Dashboard Widgets Explained
The dashboard is organized into draggable widgets, each focusing on a specific aspect of your business. You can rearrange widgets by dragging them to create your preferred layout, and your arrangement is saved automatically.
Ticket Status Cards
The top row displays ticket counts across various categories. Click on any stat card to navigate directly to the tickets page with the appropriate filter applied.
| Stat Card | Description | Why It Matters |
|---|---|---|
| Open Tickets | Tickets with "open" status awaiting work | Shows your current workload queue |
| Closed (All Time) | Total completed tickets in your system | Track your overall repair history |
| Closed Today | Tickets completed today | Measure daily productivity |
| Updated Today | Tickets with activity today | See which repairs are being actively worked |
| Due Today | Tickets with today's due date | Prioritize urgent completions |
| Due Soon (3 Days) | Tickets due within the next 3 days | Plan ahead for upcoming deadlines |
| Stale Tickets (72h+) | Open tickets without updates for 72+ hours | Identify forgotten or stuck repairs |
Performance Metrics
The Performance Metrics widget displays key efficiency indicators calculated over the past 30 days, along with additional status counts.
| Metric | What It Shows | Business Insight |
|---|---|---|
| Avg Response Time | Average time from ticket creation to first update | Measures how quickly your team responds to new repairs |
| Avg Resolution Time | Average time from ticket creation to completion | Tracks overall repair turnaround efficiency |
| In Progress | Tickets currently being worked on | Shows active workload |
| On Hold | Tickets paused (waiting for parts, approval, etc.) | Identify bottlenecks requiring attention |
Charts and Visualizations
Three interactive charts provide visual insights into your repair shop operations:
Open Tickets by Technician
A doughnut chart showing how open tickets are distributed among your technicians. This helps identify workload imbalances and ensure fair distribution of repairs across your team.
Ticket Trends (6 Months)
A bar chart comparing tickets opened versus tickets closed over the past six months. Use this to identify seasonal patterns, growth trends, and whether your team is keeping pace with incoming work.
Active Subscriptions
A doughnut chart displaying the breakdown of active RMM maintenance plan subscriptions by plan tier (Calling Card, Bronze, Silver, and Gold by default - the display names are customizable in RMM settings). This helps you understand your recurring revenue distribution and customer tier mix.
Recent Activity Feed
The activity feed displays the 10 most recently updated tickets. Each entry shows:
- Ticket number and subject
- Current status (indicated by color-coded icon)
- Customer name and assigned technician
- Time since last update (e.g., "5m ago", "2h ago")
Click any activity item to open that ticket's detail page directly.
Tip: For detailed revenue reports, sales analytics, and comprehensive business metrics, visit the Reports section which provides in-depth financial analysis.
Understanding Dashboard Metrics
The dashboard displays key performance indicators (KPIs) that help you measure your repair shop's efficiency. Understanding these metrics allows you to identify areas for improvement and track progress over time.
Ticket Status Metrics
| Metric | What It Measures | What to Watch For |
|---|---|---|
| Open Tickets | Repairs in queue awaiting work | Rising numbers may indicate staffing needs |
| Stale Tickets (72h+) | Open tickets without updates for 3+ days | Should be minimized - investigate any stale tickets |
| Due Today / Due Soon | Tickets approaching their deadline | Prioritize these to maintain customer satisfaction |
| Closed Today | Repairs completed in the current day | Compare to open tickets to gauge productivity |
Performance Metrics
| Metric | Calculation | Target Range | Improvement Tips |
|---|---|---|---|
| Average Response Time | Time from ticket creation to first status update (30-day average) | Under 4 hours for standard repairs | Ensure technicians update tickets promptly when starting work |
| Average Resolution Time | Time from ticket creation to completion (30-day average) | 24-72 hours (varies by repair complexity) | Streamline diagnosis, maintain parts inventory, clear communication |
Want More Analytics? The dashboard shows operational metrics. For detailed financial reports, revenue analysis, sales by product/service, and comprehensive business analytics, visit the Reports section.
Dashboard Actions and Navigation
The dashboard header provides controls for managing your view, and the sidebar offers quick navigation to create new records.
Dashboard Controls
Refresh Button
Click to reload all dashboard data immediately. The button spins while refreshing, and a "Last updated" timestamp shows when data was last loaded.
Reset Layout
Restores the default widget arrangement if you've customized the layout by dragging widgets around.
Global Search
The search bar in the top navigation lets you quickly find tickets, customers, or invoices by typing any identifier or name.
Clickable Stats
Click on ticket stat cards (Open, Closed, etc.) to navigate directly to the tickets page with the appropriate status filter applied.
Sidebar Navigation
The left sidebar provides quick access to all major sections of the application. Use the sidebar to navigate to:
- Tickets - View all tickets or create new repair tickets
- Customers - Manage customer records and add new customers
- Invoices - Create and manage invoices
- Estimates - Generate repair estimates for customer approval
- Assets - Track customer devices and equipment
- Reports - Access detailed analytics and generate reports
Widget Customization
All dashboard widgets can be rearranged by dragging and dropping:
- Hover over any widget to see the drag handle icon in the corner
- Click and drag the widget to swap positions with another widget
- Your layout is automatically saved and will persist across sessions
- Use "Reset Layout" to restore the default arrangement
Multi-Location Businesses
RAD Repairs supports businesses with multiple shop locations. The dashboard gives you a single organization-wide view, while other pages let you drill into individual shops.
Organization-Wide Overview
The dashboard's ticket stats, performance metrics, charts, and recent activity cover your whole organization, so owners and managers get the complete picture in one place regardless of which location is selected in the sidebar.
Per-Location Views on Other Pages
When you need to focus on one shop, use the per-location tools on the working pages:
- Tickets - The tickets page has a Location dropdown to show one shop or All Locations
- Customers - The customer list can be filtered by location
- Inventory - Stock levels are tracked per location
- Tax Settings - Each location has its own state and local tax rates
User Location Assignments
Team members can be assigned to one or more locations in Admin Settings under User Management, which keeps staff records organized by the shop where they work.
Setting Up Multiple Locations: To add additional locations to your account, navigate to Admin Settings and find the Locations section. Each location has its own address, contact information, timezone, and tax settings.
Frequently Asked Questions
Common questions about using the RAD Repairs Dashboard effectively.
How often does the dashboard data refresh?
The dashboard does not auto-refresh. Click the "Refresh" button in the top-right corner to reload all data, or press F5 to refresh the entire page. The "Last updated" timestamp shows when the data was last loaded.
Can I customize which widgets appear on my dashboard?
While you cannot add or remove widgets, you can rearrange them by dragging and dropping. Your custom layout is saved automatically and persists across sessions. Use the "Reset Layout" button to restore the default arrangement.
Why don't I see any data on my dashboard?
If your dashboard appears empty, there are a few possible reasons:
- You may not have created any tickets, customers, or invoices yet
- Ensure you have the correct permissions to view dashboard data
- If you recently migrated data, it may still be processing - try the Refresh button
Where are the revenue metrics?
The dashboard focuses on operational ticket metrics and performance indicators. For revenue figures, sales analytics, and financial reports, visit the Reports section where you can generate detailed sales reports, invoice summaries, and revenue analysis.
Can I export dashboard data?
The dashboard provides a quick operational overview. For detailed exports and reports, visit the Reports section. There you can generate comprehensive reports in PDF format with detailed breakdowns of tickets, revenue, and business performance.
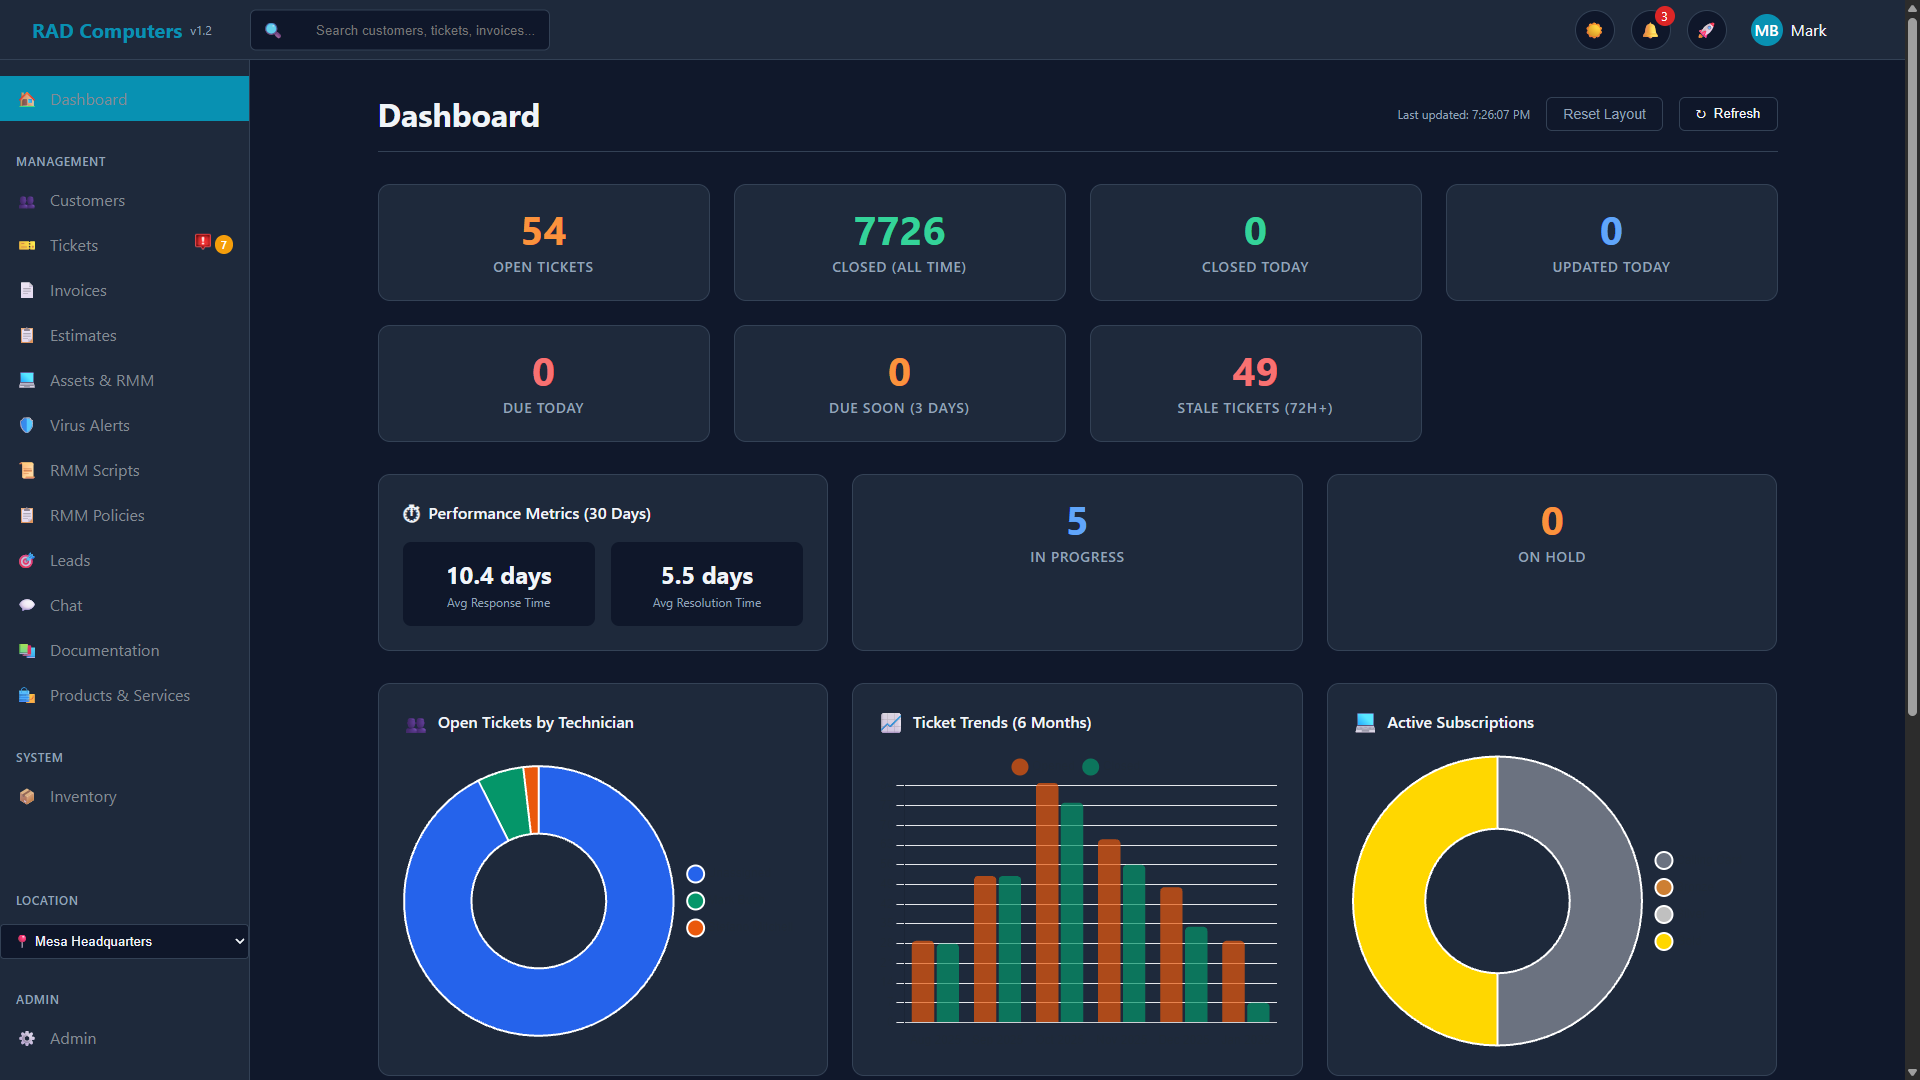
How do I change my default dashboard view?
Your custom widget arrangement is remembered automatically, and theme preferences (light/dark mode) are also saved. Drag widgets into the order you like and the dashboard will look the same on your next visit. Use "Reset Layout" to go back to the default arrangement.
What do the different status colors mean?
Stat cards and activity items use consistent colors:
- Blue - Informational metrics (Updated Today, In Progress)
- Orange/Yellow - Warning items (Open Tickets, Due Soon, On Hold)
- Green - Positive metrics (Closed, Completed)
- Red - Urgent attention needed (Due Today, Stale Tickets)
Can multiple users view the dashboard simultaneously?
Yes, the dashboard supports unlimited concurrent users. Each user sees data appropriate to their permission level, and each user can have their own custom widget layout. Changes made by one user appear for others on their next manual refresh.
What are the subscription tiers shown in the Active Subscriptions chart?
The Active Subscriptions chart shows customer devices enrolled in RMM maintenance plans. The default tiers are Calling Card, Bronze, Silver, and Gold, and you can rename them in Admin Settings under RMM settings. See the RMM & Monitoring documentation for details on maintenance plans and automatic recurring billing.
Related Documentation
Explore these related features to get the most out of your RAD Repairs system:
Tickets
Learn the complete ticket workflow from customer check-in through repair completion and pickup. Master status tracking, technician assignments, and customer communication.
Reports
Generate detailed analytics and reports on revenue, ticket volume, technician performance, and business trends. Export to PDF for record-keeping and analysis.
Customers
Manage your customer database, view service history, track communication preferences, and build lasting relationships with repair shop clients.
Admin Settings
Configure your shop locations, user permissions, integrations, branding, and system-wide settings that affect dashboard behavior.
Need Help with Your Dashboard?
If you're experiencing issues with your dashboard or need assistance understanding your metrics, our support team is ready to help.
Contact Support